Words + Numbers
TELLING STORIES THROUGH DATA JOURNALISM AND FREEDOM OF INFORMATION
Helping you improve your skills with resources and training

Who I am
Data journalist + FOI expert
My name is Claire Miller and I am an award winning investigative data journalist working across national and regional newspapers in the UK, with more than a decade’s experience of using data skills to dig out data, find stories, and create visualisations.
What I do
My areas of expertise

Data Journalism
Turning official data, statistics, and FOI responses into interesting, engaging exclusive stories that connect with readers.

Data Analysis
Spending hours trying to clean messy data or analysing information. Are there quicker techniques and formulas?

Data Visualisation
Visually telling your data stories can be the strongest way to get your point across. But what makes a great graph?

Freedom of Information
From ideas to get you started with sending your first FOI request to help with fighting refusals and other challenges.
Freedom of Information in the news – week ending 8/8/2025 – #FOIFriday
Blog
Telling Stories through Numbers
Regularly updated with tutorials and tips, the Telling Stories through Numbers blog is a great first stop for learning more about data journalism and Freedom of Information.
How to posts walk you through finding, cleaning, analysing, and visualising data, while the regular #FOIFriday features is a weekly update on repeatable FOI ideas.
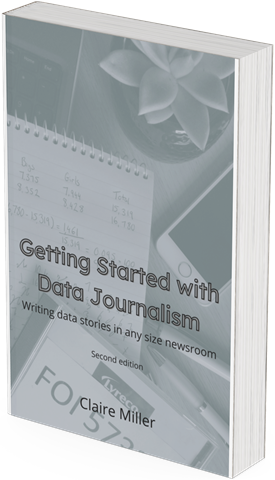
Getting Started with Data Journalism
This e-book is packed with data journalism tips and tutorials to help you find data, analyse and visualise, and create great stories.

my stories


