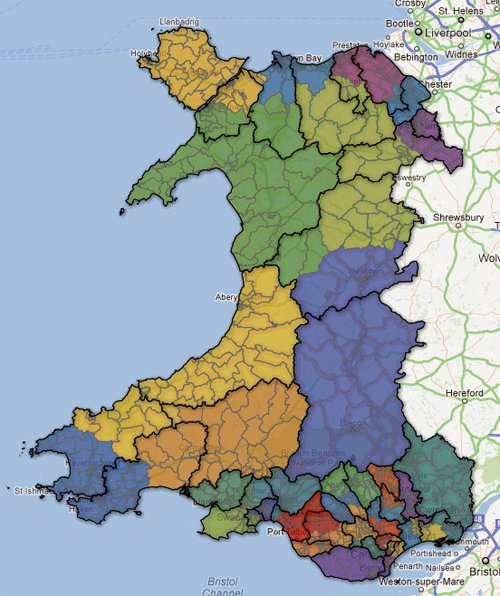
…or how I made the Welsh boundary changes map.
I knew the announcement was due and that we would need a way to display it.
And got to thinking about whether there was a way to overlay the new boundaries and the current ones.
As a side note, I asked for shapefiles, because they’re relatively easy to work with, was assured that I should get some sort of shapefile.
I got MapInfo files, which I’m not sure anyone else in Government uses and for which we don’t have any software so Tuesday was a day for finding a way to conjure up something out of not a lot.
Given that constituencies are made up of wards and I have shapefiles for all the wards in Wales (which by luck, I’d been using the day before for the child poverty map, so had a file of codes and ward names ready to go), it ended up being a bit of a jigsaw job.
A very tedious jigsaw job, of going through 30 pdfs of the new seats and adding the name in the column next to the wards within.
Thankfully I managed to avoid having to do the same for the current seats as the Boundary Commission for Wales has on its (state of the art) website an excel document setting out electorates for each seat by ward.
That done I gave each seat a number and all the wards in the seat the same number in order to colour them in Google Fusion Tables.
Once the data was imported into Fusion Tables, merged with the kml files and turned into maps (I’m planning a how to on this soon, obviously this is back to front), I had a coloured wards map of the new constituencies and a map of the current constituencies with the fill sent to transparent with black borders.

This post by Michelle Minkoff was invaluable for combining the two, mainly because it has all the code needed to create the map.
Basically all I did was change the table numbers, centring point (the number of maps I make means I know the lat, long coordinates to centre a map on Wales off by heart) and zoom, and then handed it over to the online team to be embedded in WalesOnline.
I can really see this technique being useful for the local elections, to ensure neat local authority boundaries around wards.
Plus now I have a strong desire to create map mash ups of all kinds of data to create supermaps.


